Domain colouring plots of complex functions
Basic settings for the plotter
Hue

The hue is selected according to the angle.
Lightness


The brightness is determined according to the following diagram.
In the interval [0,0.5) applies val = a1 * k + b1
In the interval [0.5,1) applies val = a2 * k + b2
It is: min ≤ val ≤ max
Saturation


The saturation is determined according to the following diagram.
In the interval [0,0.5) applies sat = a1 * k + b1
In the interval [0.5,1) applies sat = a2 * k + b2
It is: min ≤ sat ≤ max
Selecting a color scheme:
Set width and height of the plot:
Setting the saturation gradient:
Setting the brightness gradient:
Representation of complex functions
Linear complex function

Real part of f(z):
Imaginary part of f(z):
Amount of f(z):
Argument φ of f(z):
Square complex function

Real part of f(z):
Imaginary part of f(z):
Amount of f(z):
Argument φ of f(z):
Fractional rational complex function

Real part of f(z):
Imaginary part of f(z):
Amount of f(z):
Argument φ of f(z):
Fractional linear function

Real part of f(z):
Imaginary part of f(z):

The function f is a composition of the previous f=f1+f2 and so the real and imaginary parts result from the addition of the individual functions f1 and f2.
Real part of f(z):
Imaginary part of f(z):
Complex e-function

Real part of f(z):
Imaginary part of f(z):
Amount of f(z):
Argument φ of f(z):
exp(z) / (z-a)

The function f is a product of two functions f=f1 * f2 and then the real and imaginary result follows:
Real part of f(z):
Imaginary part of f(z):
exp(z)/(z-a) + (z+b)/(z+c)

The function f is a product of two functions f=f1 * f2 and then the real and imaginary result follows:
Real part of f(z):
Imaginary part of f(z):
The function f is also the sum of two functions f=f1+f2 and so the real- and imaginary part results from addition of f1 and f2.
Real part of f(z):
Imaginary part of f(z):
Complex sine function

Real part of f(z):
Imaginary part of f(z):
Amount of f(z):
Argument φ of f(z):
x2 + i y2

Real part of f(z):
Imaginary part of f(z):
Amount of f(z):
Argument φ of f(z):
General
The function theory investigates functions of complex variable functions so complex numbers whose values range are also complex numbers. The complex numbers are an extension of the real numbers in the two-dimensional space. Many computational rules of real numbers can be applied to complex numbers. Was justified, the theory of complex functions mainly by Augustin-Louis Cauchy, Bernhard Riemann, and Karl Weierstrass.
Domain Colouring
The color wheel method is a method to graphically represent complex functions. Complex functions represent the two-dimensional complex plane in turn, the real and imaginary values. The color circle method used amount r = |f(z)| and angle φ the complex function value f(z) aroand the display color of the function value set. According to r and φ the function value is selected the color from the color wheel. The amount defines the saturation and modulo is mapped to intervals . The first interval is 0 .. 1 then follow the intervals ( 1 .. e] , (e. .. e 2 ] , (e 2 ... e 3 ], etc. the color is defined by the angle and in 6 color zones starting with split blue from 0° to 60° and ending with green from 300° to 360°. the method is designed to that the function values are close together are also displayed similar color. mapping the sums on intervals of the power of e corresponds to a logarithmic representation.
Colour Wheel
A compilation of a color wheel can be put together from different points depending on which state of affairs is to be visualized. The basis for the color circle the perception of similar colors. Leaving subjects with normal color pattern according to the sensation on similarity sort, which hues are usually brought in the same order. Beginning and end of the series are aroand so similar that the series can be closed to form a circle.

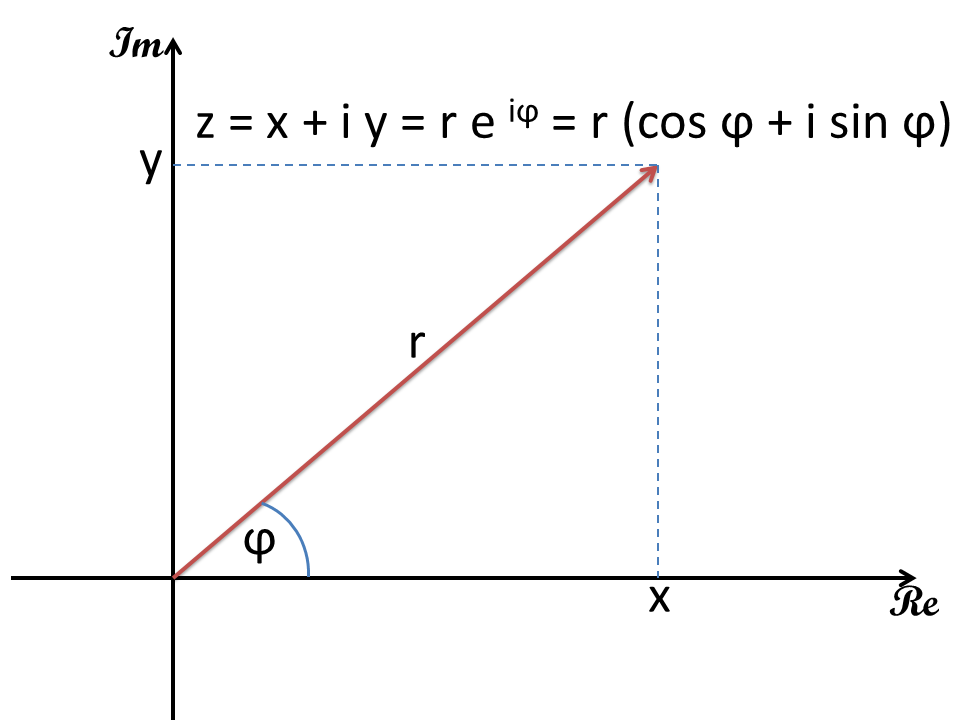
Gauss Plane
The complex numbers are two-dimensional and can be used as vectors in the Gaussian plane of numbers represent. On the horizontal axis (Re) of the real part and on the vertical axis is applied (Im) of the imaginary part of the complex number. Vectors may also be similar to either the complex number in Cartesian coordinates (x, y) or polar coordinates (r, φ) can be expressed. In the color circle method polar coordinates are used and the color wheel is placed on the manner interval Gaussian-number plane.
More Calculators
The online calculator calculates the solutions of quadratic equations with solution steps.
Complex Numbers Complex numbers graphically Addition complex numbers Multiplication complex numbers Division complex numbers Power complex numbers Complex functions Editor to display complex functions Quadratic equation calculation rules Normal form to vertex form Parabola Plotter