Online graphically sum of complex numbers
Addition and difference of the complex numbers z1 and z2
The operation with the complex numbers is graphically presented. The resulting sum is given by the red vector. By moving the vector endpoints the complex numbers can be changed. The dotted lines are the parallel moved vectors.
Complex numbers
Gauss plane:
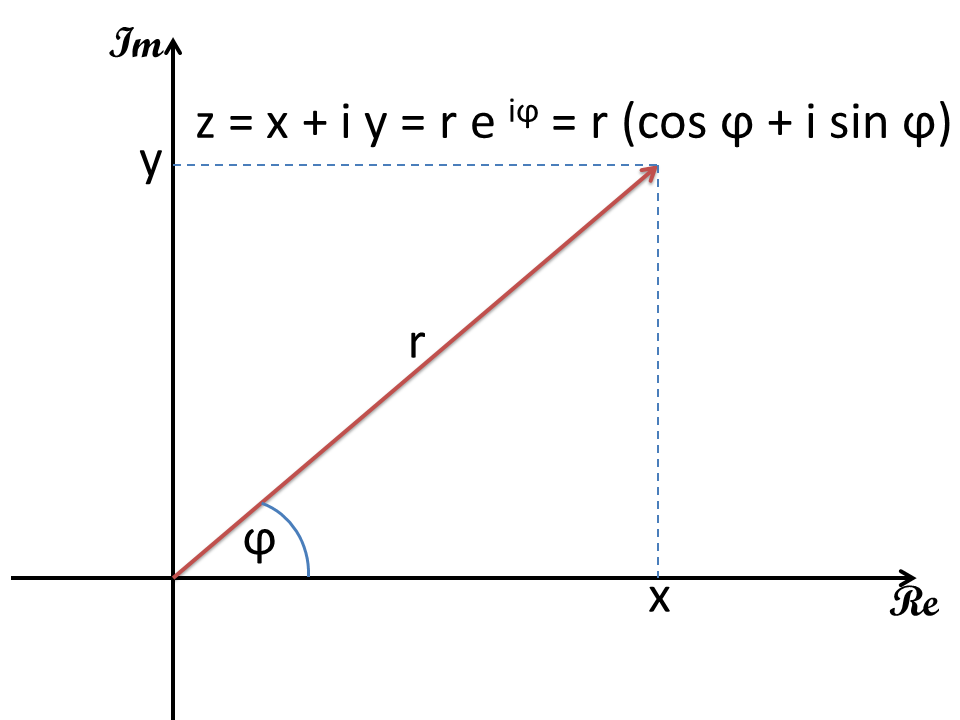
The complex numbers are two-dimensional and can be used as vectors in the Gaussian plane of numbers represent. On the horizontal axis (Re) of the real part and on the vertical axis is applied (Im) of the imaginary part of the complex number. Similar to vectors complex numbers can be expressed in Cartesian coordinates (x, y) or polar coordinates (r, φ).
Addition and subtraction of complex numbers
The addition and subtraction of complex numbers corresponding to the addition and subtraction of the position vectors. That the real and imaginary components are added or subtracted.
z1 + z2 = x1 + x2 + i ( y1 + y2 )
z1 - z2 = x1 - x2 + i ( y1 - y2 )
Screenshot of the Image
Print or save the image via right mouse click.
More Calculators
Here is a list of of further useful calculators:
Complex numbers calculator Complex numbers graphically Addition complex numbers graphically Multiplication complex numbers graphically Division complex numbers graphically Power complex numbers graphically Complex functions