Logistic Growth Model
The model of exponential growth extends the logistic growth of a limited resource. The solution of the differential equation describing an S-shaped curve, a sigmoid. In the center of the development, the population is growing the fastest, until it is slowed by the limited resources.
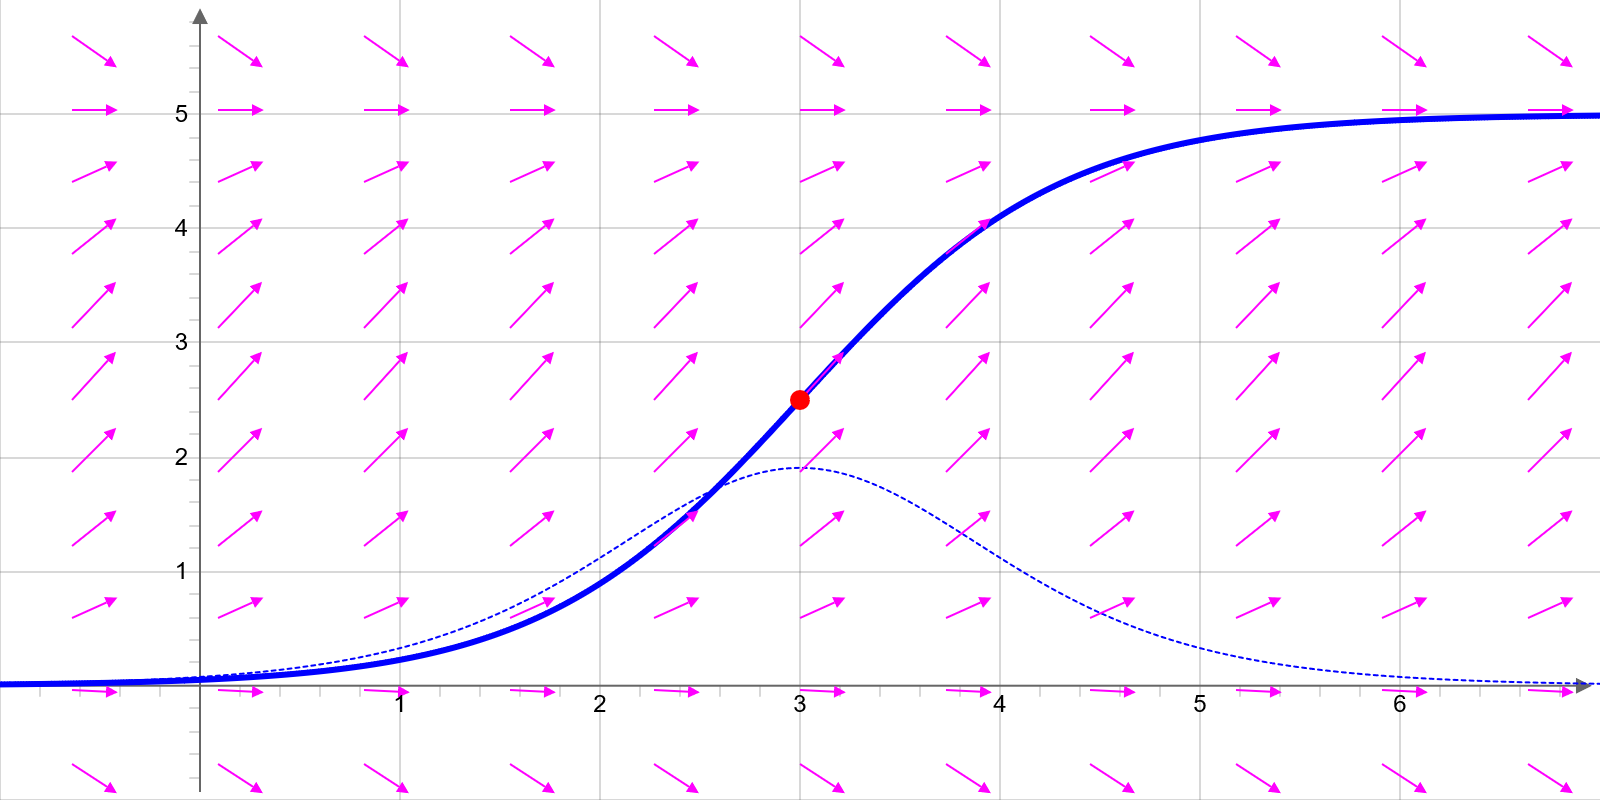
Figure: The figure shows a logistic growth curve and its derivative as dotted curve. The maximal growth is indivated by the red dot. The vectors show the direction field of the growth model.
Logistic Growth Formula
Differential equation of logistic growth:
With the growth function for the inital values t0 = 0 and y0 = y(0)
With the growth function for the general inital values t0 and y0 = y(t0)
Turning point of the logistic growth function:
At the turning point of the logistic growth function value equal to half the saturation limit.
Maximum growth rate:
The maximum growth rate is achieved at the turning point.
Application Examples
Growth of populations with limited resources
Logistic regression
Neural networks
Modeling of a pandemic
Differential equation of logistic growth
The logistic growth is described by a differential equation with constant factors k and G.
Differential equation of logistic growth
Separation of variables
Integration gives
Dissolving and replacing the initial condition t0, y0 yields the solution of the logistic differential equation
Calculator for the logistc growth function
Screenshot of the logistc growth graph
Print or save the image via right mouse click.
Releated sites
Here is a list of of further useful sites:
Index Exponential growth function Function Plot Normal Distribution Plot Curve fit calculator Damped Vibration Plot Derivative calculus Partial derivatives and gradient Tangent (tan) Plot Beat frequencies Plot